The plugin profiler is solution that can be installed on any Dynamics 365 instance and can be used to generate plug-in traces that can then be used to step through the plug-in code.
The key difference is that the stepping through the code is done after the plug-in has run and not in real time. In short, the sequence is as follows:
- Trigger Plug-in (e.g. create account ...)
- Save Plug-in trace
- Load Plug-in trace with Plugin Registration Tool
- Step Through plug-in code.
Pre-Requisites
- Plugin Registration Tool installed (see this post for more details)
- Admin access to Dynamics 365 instance
- Visual Studio 2017
Debugging Online Plug-ins
- Start Plugin Registration Tool
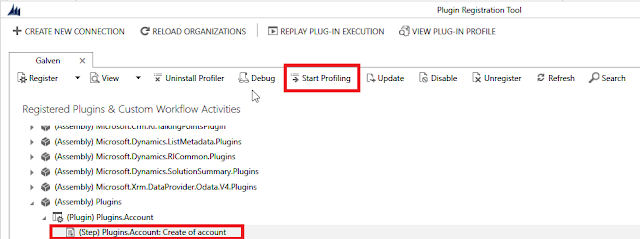
- Click Install Profiler
- Select the step to be profiled
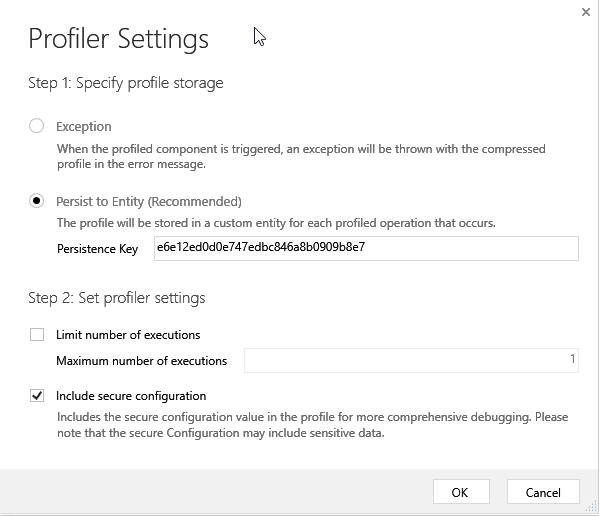
- Click Start Profiling
- Go with the defaults
- Invoke Step (Create account in this case)
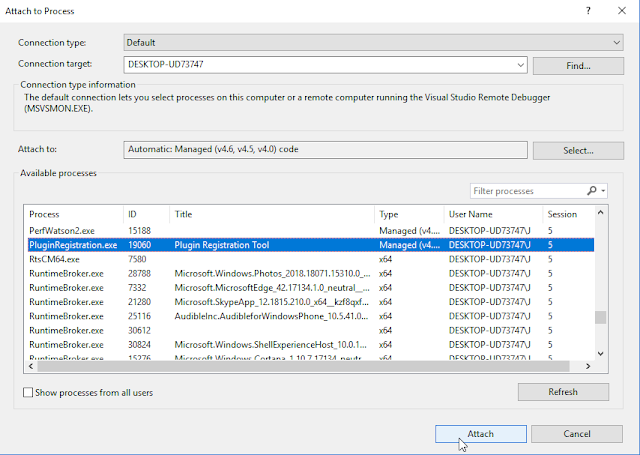
- On Visual Studio, Click Debug | Attach To Process | PluginRegistrationTool.exe
- Click Debug
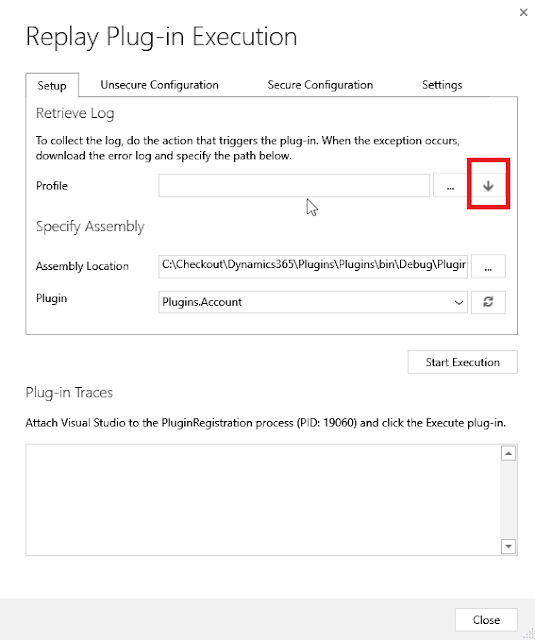
- Select Assembly Location and Relevant Plugin
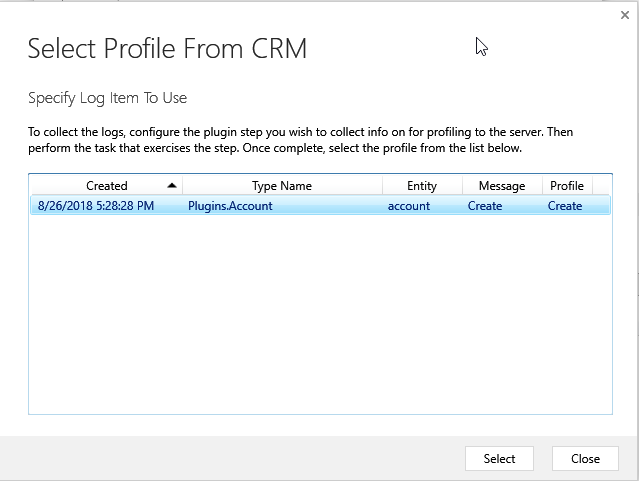
- Click on Highlighted arrow and select profile
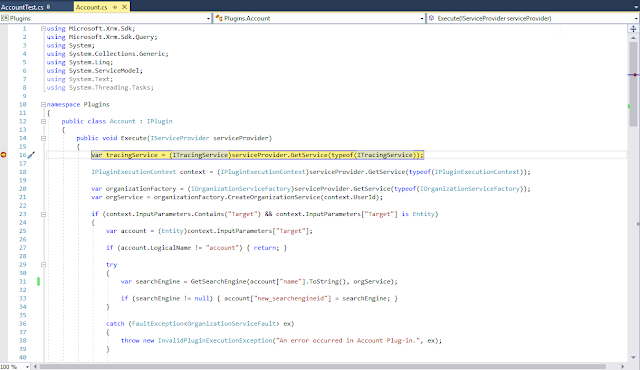
- Place a break point on Visual Studio
- Click Start Execution
- The break point will be hit and we can step through the code at our leisure
No comments:
Post a Comment